统计了13种均线战法的胜率,5分钟带你看看谁的胜率更高
相信很多新手和资深交易员都会用均线来判断趋势,但你有没有想过,不同的均线策略,其准确率和收益可能差别很大?
这篇文章将系统整理13种最常见的均线策略,从经典的短期均线交叉到长期趋势判断,一步步帮你量化这些策略的买卖信号,并最终比较它们的实战效果。
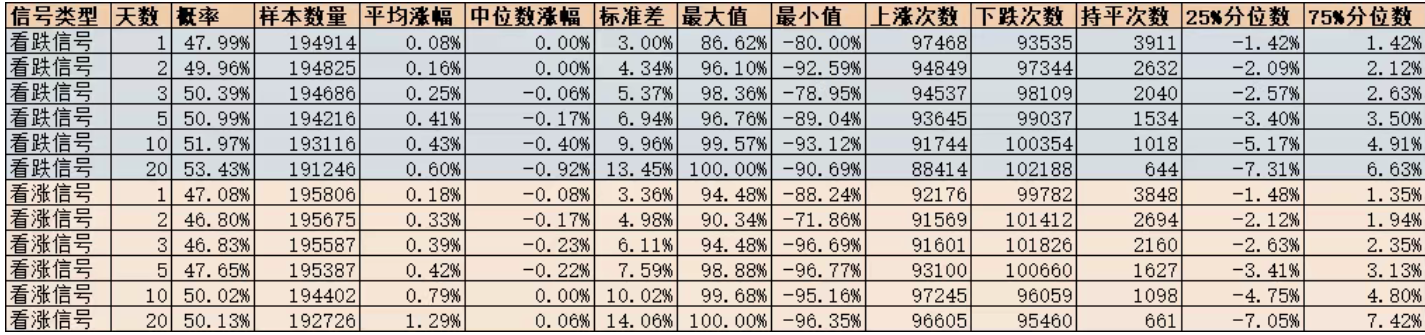
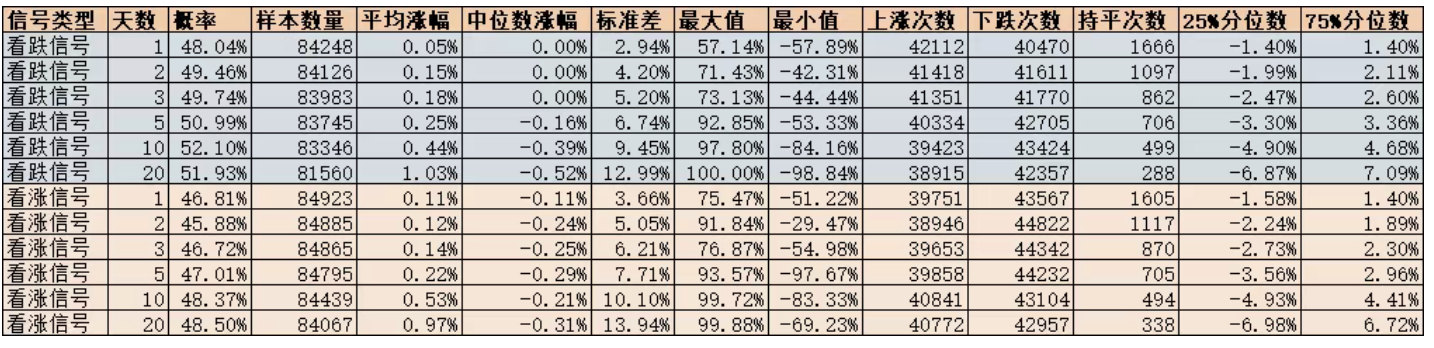
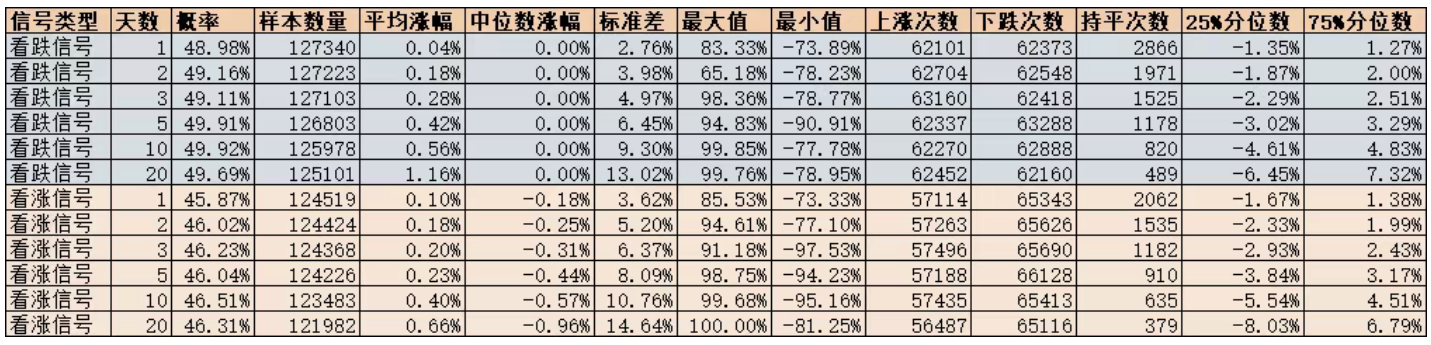
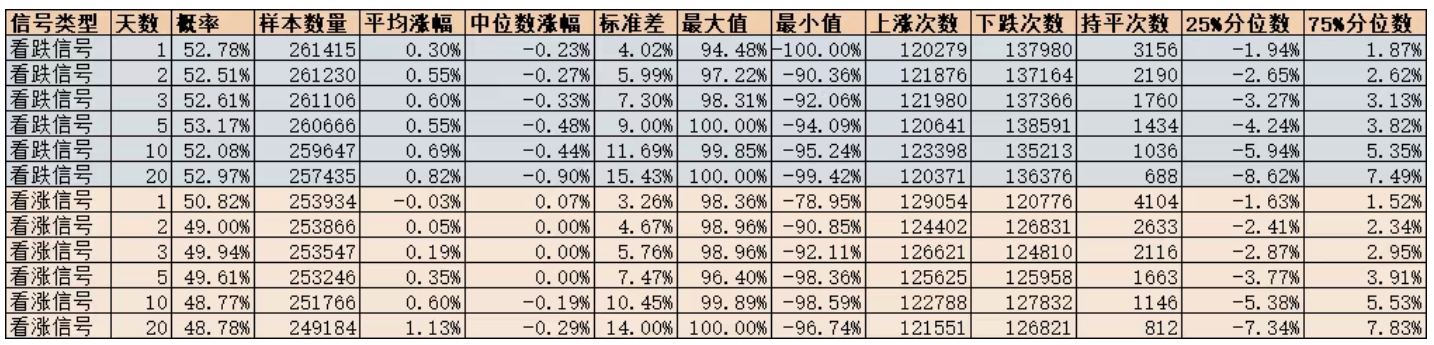
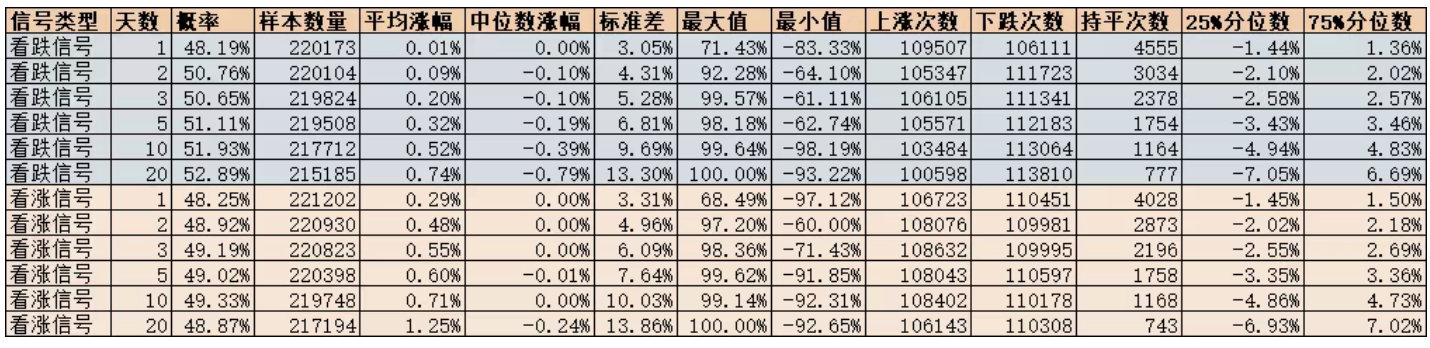
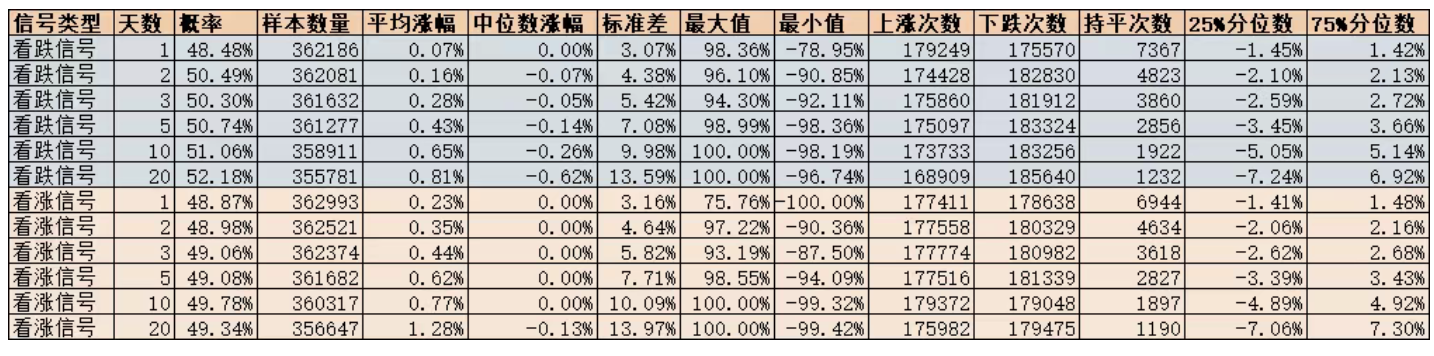
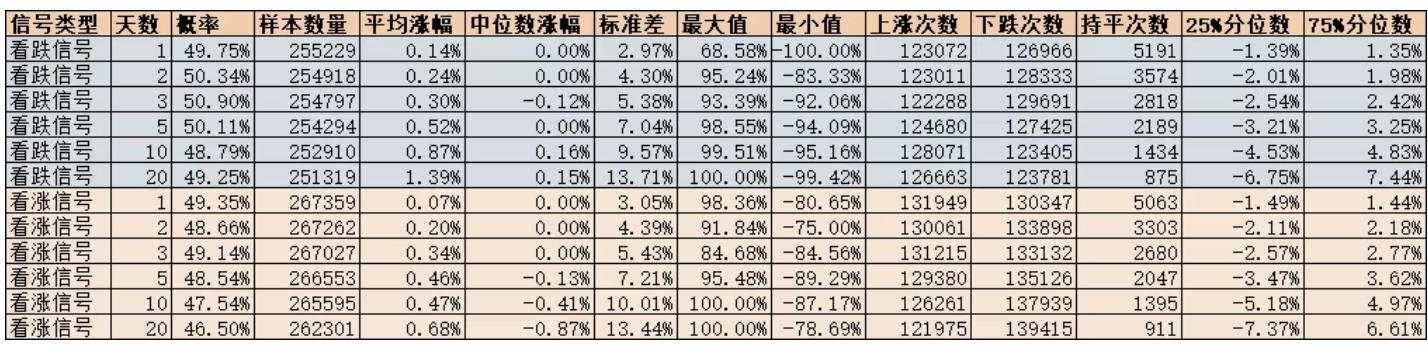
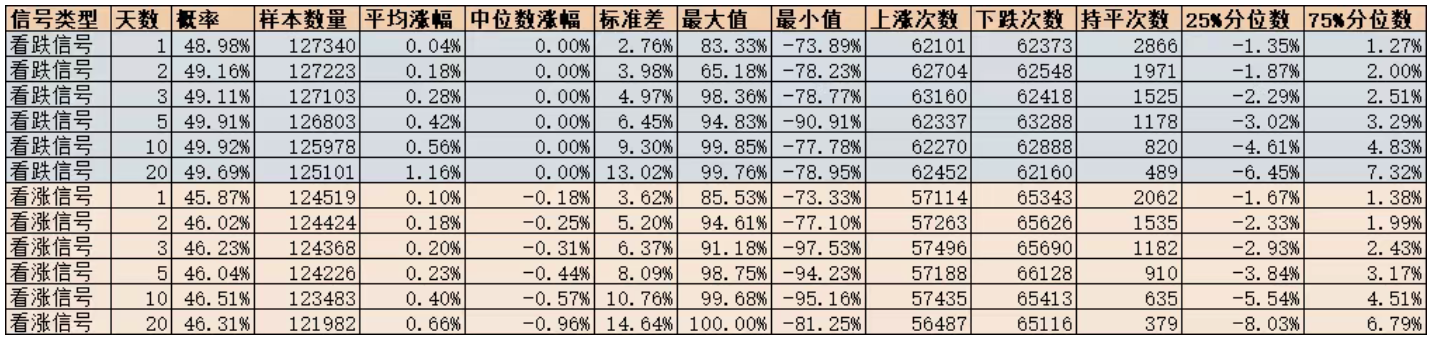
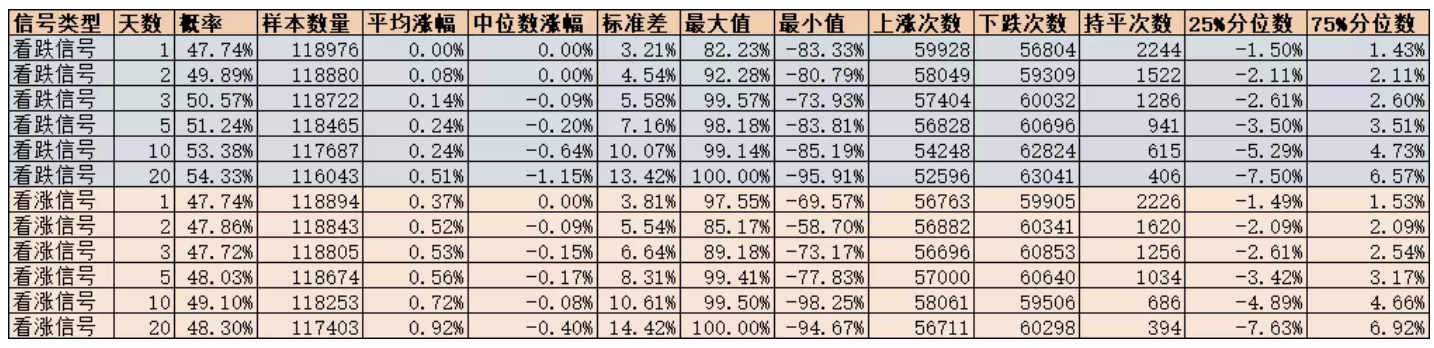
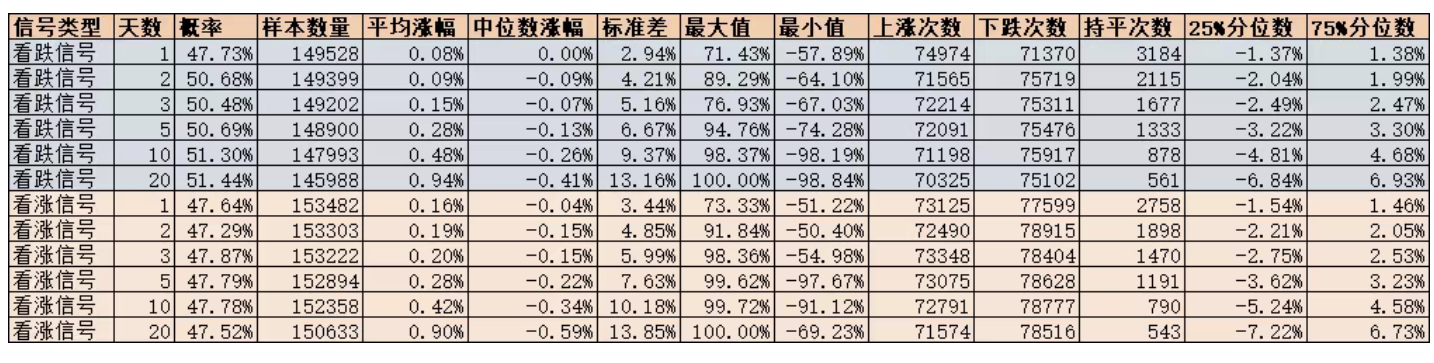
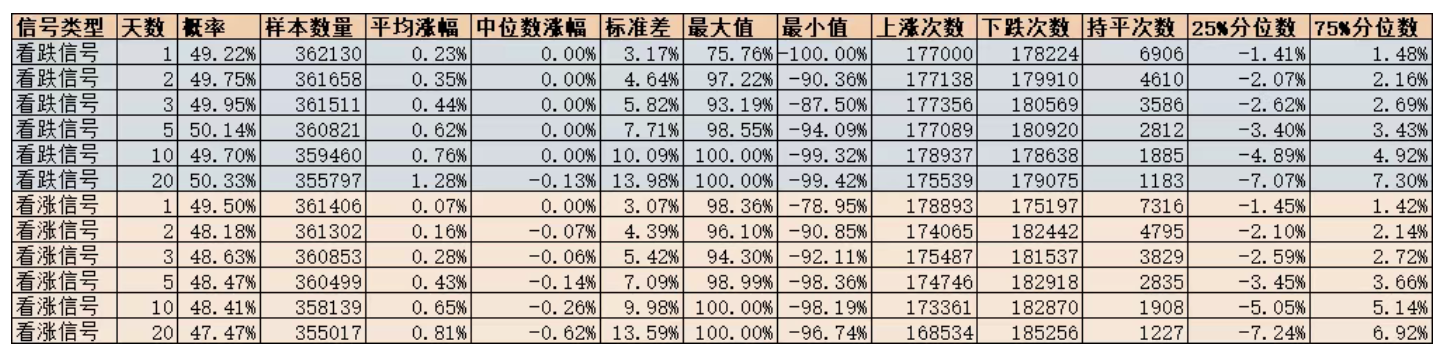
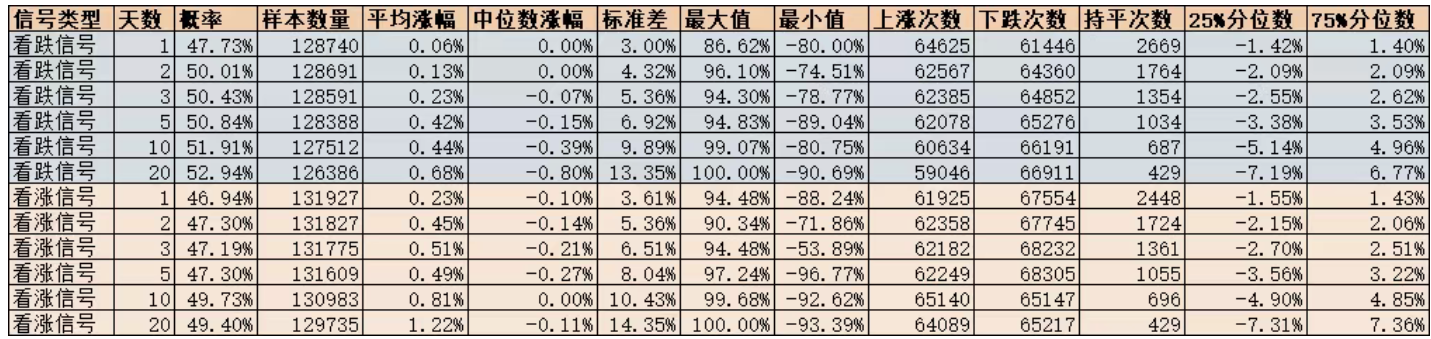
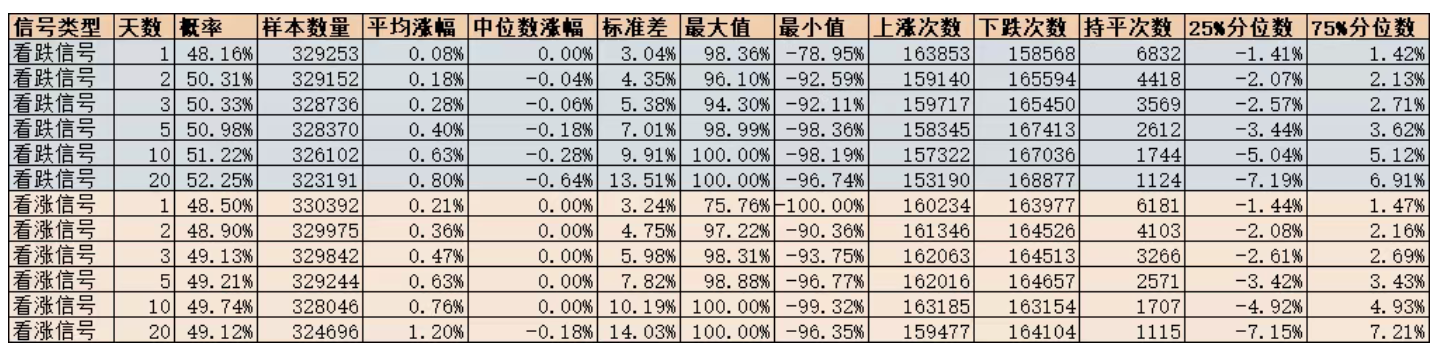
当出现买入和卖出信号以后,分别对1、2、3、5、10、20日后涨跌做了统计分析,包括概率(N日后涨跌幅为正的概率)
1.短期均线金叉/死叉(MA5 & MA20)
这是最经典的均线交叉策略,短期均线(5日)上穿长期均线(20日)为金叉买入信号,下穿为死叉卖出信号。适合捕捉短期趋势起点和转折点。
1
2
3
4
5
6
7
8
9
10
11
12
| def technical_ma_cross(df):
df = df.copy()
df['ma5'] = df['close'].rolling(5).mean()
df['ma20'] = df['close'].rolling(20).mean()
con1 = (df['ma5'] > df['ma20']) & (df['ma5'].shift(1) <= df['ma20'].shift(1))
con2 = (df['ma5'] < df['ma20']) & (df['ma5'].shift(1) >= df['ma20'].shift(1))
df['signal'] = None
df.loc[con1, 'signal'] = 1
df.loc[con2, 'signal'] = 0
return df
|
2.双均线交叉策略(MA10 & MA50)
中短期均线交叉,用于捕捉中期趋势。MA10上穿MA50为买入,下穿为卖出,信号比短期金叉更平滑,噪声更少。
1
2
3
4
5
6
7
8
9
10
11
12
| def technical_double_ma(df):
df = df.copy()
df['ma10'] = df['close'].rolling(10).mean()
df['ma50'] = df['close'].rolling(50).mean()
con1 = (df['ma10'] > df['ma50']) & (df['ma10'].shift(1) <= df['ma50'].shift(1))
con2 = (df['ma10'] < df['ma50']) & (df['ma10'].shift(1) >= df['ma50'].shift(1))
df['signal'] = None
df.loc[con1, 'signal'] = 1
df.loc[con2, 'signal'] = 0
return df
|
3.三均线系统(MA5, MA20, MA60)
三条均线组合用于判断多空排列:短期>中期>长期为多头排列,反之为空头排列。买卖信号更严格,减少震荡行情误操作。
1
2
3
4
5
6
7
8
9
10
11
12
13
| def technical_triple_ma(df):
df = df.copy()
df['ma5'] = df['close'].rolling(5).mean()
df['ma20'] = df['close'].rolling(20).mean()
df['ma60'] = df['close'].rolling(60).mean()
con1 = (df['ma5'] > df['ma20']) & (df['ma20'] > df['ma60']) & ~((df['ma5'].shift(1) > df['ma20'].shift(1)) & (df['ma20'].shift(1) > df['ma60'].shift(1)))
con2 = (df['ma5'] < df['ma20']) & (df['ma20'] < df['ma60']) & ~((df['ma5'].shift(1) < df['ma20'].shift(1)) & (df['ma20'].shift(1) < df['ma60'].shift(1)))
df['signal'] = None
df.loc[con1, 'signal'] = 1
df.loc[con2, 'signal'] = 0
return df
|
4.均线乖离率策略(MA20 + 价格偏离)
当价格偏离均线过大(如上下5%),可能存在回调或反弹的机会。价格低于MA20一定比例买入,高于一定比例卖出。适合捕捉短期极端波动。
1
2
3
4
5
6
7
8
9
10
11
| def technical_bias(df, ma=20, threshold=0.05):
df = df.copy()
df['ma'] = df['close'].rolling(ma).mean()
con1 = (df['close'] < df['ma'] * (1 - threshold)) & ~(df['close'].shift(1) < df['ma'].shift(1) * (1 - threshold))
con2 = (df['close'] > df['ma'] * (1 + threshold)) & ~(df['close'].shift(1) > df['ma'].shift(1) * (1 + threshold))
df['signal'] = None
df.loc[con1, 'signal'] = 1
df.loc[con2, 'signal'] = 0
return df
|
5.均线突破策略(价格上穿MA50)
价格突破长期均线(如MA50)通常意味着趋势开始。上穿买入,下穿卖出,适合追随趋势行情。
1
2
3
4
5
6
7
8
9
10
11
| def technical_ma_break(df, ma=50):
df = df.copy()
df['ma'] = df['close'].rolling(ma).mean()
con1 = (df['close'] > df['ma']) & (df['close'].shift(1) <= df['ma'].shift(1))
con2 = (df['close'] < df['ma']) & (df['close'].shift(1) >= df['ma'].shift(1))
df['signal'] = None
df.loc[con1, 'signal'] = 1
df.loc[con2, 'signal'] = 0
return df
|
6.均线支撑/阻力策略(价格回到MA支撑)
均线可作为动态支撑和阻力。价格回调到均线支撑附近买入,碰到均线阻力卖出,适合顺势做波段交易。
1
2
3
4
5
6
7
8
9
10
11
| def technical_ma_support(df, ma=20):
df = df.copy()
df['ma'] = df['close'].rolling(ma).mean()
con1 = (df['close'] > df['ma']) & (df['close'].shift(1) <= df['ma'].shift(1))
con2 = (df['close'] < df['ma']) & (df['close'].shift(1) >= df['ma'].shift(1))
df['signal'] = None
df.loc[con1, 'signal'] = 1
df.loc[con2, 'signal'] = 0
return df
|
7.均线回调买入策略(价格回调至MA且MA上行)
当价格回调至均线附近,同时均线呈上升趋势时买入,下跌趋势卖出。这种策略结合趋势和回调,降低误操作概率。
1
2
3
4
5
6
7
8
9
10
11
12
| def technical_ma_pullback(df, ma=20):
df = df.copy()
df['ma'] = df['close'].rolling(ma).mean()
df['ma_diff'] = df['ma'].diff()
con1 = (df['close'] < df['ma']) & (df['ma_diff'] > 0) & ~((df['close'].shift(1) < df['ma'].shift(1)) & (df['ma_diff'].shift(1) > 0))
con2 = (df['close'] > df['ma']) & (df['ma_diff'] < 0) & ~((df['close'].shift(1) > df['ma'].shift(1)) & (df['ma_diff'].shift(1) < 0))
df['signal'] = None
df.loc[con1, 'signal'] = 1
df.loc[con2, 'signal'] = 0
return df
|
8.均线多空排列策略(短期>中期>长期)
通过判断均线排列顺序来捕捉趋势,短期>中期>长期为买入信号,反之为卖出。比单纯均线交叉更稳健,适合趋势明显的行情。
1
2
3
4
5
6
7
8
9
10
11
12
13
| def technical_ma_order(df, short=5, mid=20, long=60):
df = df.copy()
df['ma_short'] = df['close'].rolling(short).mean()
df['ma_mid'] = df['close'].rolling(mid).mean()
df['ma_long'] = df['close'].rolling(long).mean()
con1 = (df['ma_short'] > df['ma_mid']) & (df['ma_mid'] > df['ma_long']) & ~((df['ma_short'].shift(1) > df['ma_mid'].shift(1)) & (df['ma_mid'].shift(1) > df['ma_long'].shift(1)))
con2 = (df['ma_short'] < df['ma_mid']) & (df['ma_mid'] < df['ma_long']) & ~((df['ma_short'].shift(1) < df['ma_mid'].shift(1)) & (df['ma_mid'].shift(1) < df['ma_long'].shift(1)))
df['signal'] = None
df.loc[con1, 'signal'] = 1
df.loc[con2, 'signal'] = 0
return df
|
9.EMA短期突破策略
使用指数均线(EMA),对近期价格变化反应更快。短期EMA上穿长期EMA买入,下穿卖出,可捕捉更敏感的趋势变化。
1
2
3
4
5
6
7
8
9
10
11
12
| def technical_ema_cross(df, short=12, long=26):
df = df.copy()
df['ema_short'] = df['close'].ewm(span=short).mean()
df['ema_long'] = df['close'].ewm(span=long).mean()
con1 = (df['ema_short'] > df['ema_long']) & (df['ema_short'].shift(1) <= df['ema_long'].shift(1))
con2 = (df['ema_short'] < df['ema_long']) & (df['ema_short'].shift(1) >= df['ema_long'].shift(1))
df['signal'] = None
df.loc[con1, 'signal'] = 1
df.loc[con2, 'signal'] = 0
return df
|
10.均线加趋势过滤策略
在短期均线上穿长期均线的基础上,要求价格在长期均线之上,进一步过滤震荡信号。适合追踪主升趋势,减少横盘误操作。
1
2
3
4
5
6
7
8
9
10
11
12
| def technical_ma_trend_filter(df, short=10, long=50):
df = df.copy()
df['ma_short'] = df['close'].rolling(short).mean()
df['ma_long'] = df['close'].rolling(long).mean()
con1 = (df['ma_short'] > df['ma_long']) & (df['close'] > df['ma_long']) & ~((df['ma_short'].shift(1) > df['ma_long'].shift(1)) & (df['close'].shift(1) > df['ma_long'].shift(1)))
con2 = (df['ma_short'] < df['ma_long']) & (df['close'] < df['ma_long']) & ~((df['ma_short'].shift(1) < df['ma_long'].shift(1)) & (df['close'].shift(1) < df['ma_long'].shift(1)))
df['signal'] = None
df.loc[con1, 'signal'] = 1
df.loc[con2, 'signal'] = 0
return df
|
11.均线突破回调策略(价格突破MA后回调买入)
价格突破均线形成趋势后,回调到均线附近买入,跌破均线卖出。结合突破和回调,能更好控制入场时机。
1
2
3
4
5
6
7
8
9
10
11
| def technical_ma_break_pullback(df, ma=20):
df = df.copy()
df['ma'] = df['close'].rolling(ma).mean()
con1 = (df['close'] < df['ma']) & (df['close'].shift(1) > df['ma'].shift(1))
con2 = (df['close'] > df['ma']) & (df['close'].shift(1) < df['ma'].shift(1))
df['signal'] = None
df.loc[con1, 'signal'] = 1
df.loc[con2, 'signal'] = 0
return df
|
12.均线短期加速金叉(MA5加速上穿MA20)
短期均线快速上穿长期均线,且上升加速时发出买入信号,反之卖出。适合捕捉趋势初期的加速行情。
1
2
3
4
5
6
7
8
9
10
11
12
13
| def technical_ma_acceleration(df):
df = df.copy()
df['ma5'] = df['close'].rolling(5).mean()
df['ma20'] = df['close'].rolling(20).mean()
df['ma5_diff'] = df['ma5'].diff()
con1 = (df['ma5'] > df['ma20']) & (df['ma5'].shift(1) <= df['ma20'].shift(1)) & (df['ma5_diff'] > df['ma5_diff'].shift(1))
con2 = (df['ma5'] < df['ma20']) & (df['ma5'].shift(1) >= df['ma20'].shift(1)) & (df['ma5_diff'] < df['ma5_diff'].shift(1))
df['signal'] = None
df.loc[con1, 'signal'] = 1
df.loc[con2, 'signal'] = 0
return df
|
13.均线高低点突破策略(突破近期高点MA)
结合均线与近期高低点突破,当价格突破MA附近的5日高点买入,跌破5日低点卖出。适合捕捉连续上涨或下跌趋势的初期阶段。
1
2
3
4
5
6
7
8
9
10
11
12
13
| def technical_ma_high_low(df, ma=20):
df = df.copy()
df['ma'] = df['close'].rolling(ma).mean()
df['ma_high'] = df['ma'].rolling(5).max()
df['ma_low'] = df['ma'].rolling(5).min()
con1 = (df['close'] > df['ma_high']) & (df['close'].shift(1) <= df['ma_high'].shift(1))
con2 = (df['close'] < df['ma_low']) & (df['close'].shift(1) >= df['ma_low'].shift(1))
df['signal'] = None
df.loc[con1, 'signal'] = 1
df.loc[con2, 'signal'] = 0
return df
|
总结
统计完以后,结果真的让人吃惊,看跌信号的成功率居然完胜看涨信号,以后做均线信号是不是可以反着来
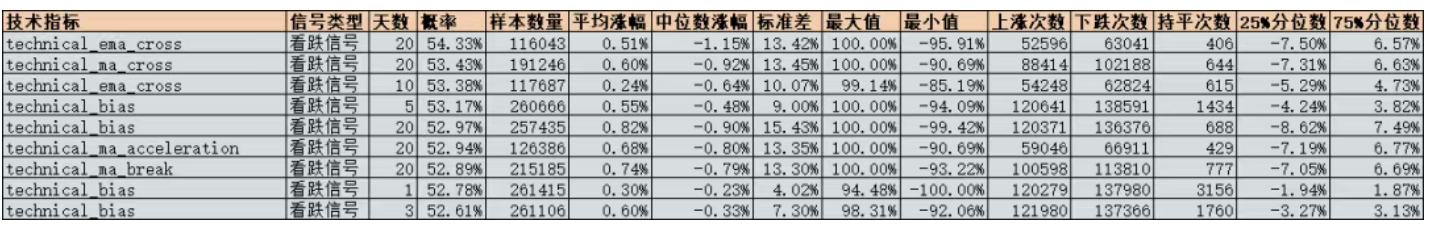
technical_ema_cross(EMA短期突破策略)和technical_ma_cross(短期均线金叉/死叉(MA5 & MA20))这2个均线指标的反向指标胜率居然排在了第一位。
整体而言,信号出现后,随着天数的增加,胜率是逐步上升的,普遍在第10天和20天能达到峰值,想做均线策略的,20天作为一个周期效果应该不错。
technical_ma_pullback(均线回调买入策略)策略虽然胜率低,但是平均收益是最高的

